Key Performance Indicators (KPIs) are essential for measuring the success of your tour business. They provide insights into both financial and non-financial aspects, helping you identify strengths, weaknesses, and opportunities for improvement. Tracking metrics like revenue growth, booking conversion rates, and customer satisfaction scores can guide better decision-making and improve overall performance. Here's what you need to know:
- Why KPIs Matter: They highlight issues early, optimize operations, and improve profitability.
- Core KPIs to Track: Financial metrics (e.g., revenue growth, customer acquisition cost) and non-financial metrics (e.g., booking conversion rates, repeat bookings).
- How to Track KPIs: Use centralized dashboards and industry-specific tools to automate and visualize data.
- Using KPI Data: Analyze trends, take action to address issues, and compare performance against industry benchmarks.
Focus on creating a reliable system to track and act on these KPIs. With the right tools and processes, you can make informed decisions that drive growth and customer satisfaction.
Key KPIs Every Tour Business Should Track
Core KPIs for Tour Operators
Tracking the right metrics can set thriving tour operators apart from those struggling to stay afloat. Successful businesses monitor both financial and non-financial KPIs to get a complete picture of their performance.
Financial KPIs focus on your monetary outcomes. For example, revenue growth helps you see if your business is expanding over time, especially when tracked as a percentage to identify trends. Average booking value shows how much customers typically spend per transaction, giving insights into pricing strategies and upselling opportunities. Customer acquisition cost (CAC) measures how much it costs to bring in each new customer, helping you evaluate the efficiency of your marketing efforts. Meanwhile, customer lifetime value (CLV) estimates the total revenue a customer generates over their relationship with your business, guiding both marketing budgets and retention strategies. Lastly, net profit margin reveals how much of your revenue you actually keep after expenses, offering a clearer look at profitability beyond gross revenue.
Non-financial KPIs provide context to your financial results. For instance, the booking conversion rate measures the percentage of website visitors who complete a purchase, helping identify potential issues in your booking process. Occupancy rate shows how effectively you're filling your tours by comparing actual participants to available slots. Metrics like customer satisfaction scores from post-tour surveys influence repeat bookings and referrals, while online review ratings on platforms such as TripAdvisor or Google directly impact your credibility and visibility. Additionally, tracking the no-show percentage and repeat booking rate can highlight operational challenges and customer loyalty trends.
How to Choose the Right KPIs
Once you've identified the metrics that matter, focus on those that address your specific business challenges. For example, if cash flow is tight, prioritize financial KPIs like average booking value or payment timing. If retaining customers is a concern, emphasize non-financial metrics like satisfaction scores and repeat booking rates.
Your business size also plays a role. Smaller operators might stick to fundamental metrics like revenue growth and customer satisfaction, while larger companies can dive deeper into details such as CAC by marketing channel or guide performance ratings. Additionally, consider your customer base: tourist-focused businesses might benefit from tracking seasonal booking patterns, while local operators might focus on repeat customer rates and community engagement.
By tailoring your KPI selection to your business needs, you'll be better equipped to evaluate their impact, as explored next.
Pros and Cons of Each KPI
Every KPI has its strengths and limitations, and understanding these trade-offs is key to creating a balanced measurement system.
| KPI | Pros | Cons |
|---|---|---|
| Revenue Growth | Easy to calculate; reflects overall business direction; useful for investor discussions | Doesn't account for profitability; may hide inefficiencies; can be skewed by seasonal fluctuations |
| Booking Conversion Rate | Highlights website and sales funnel issues; helps optimize marketing spend; measures customer interest | Doesn't reflect booking quality; influenced by external factors; requires consistent traffic data |
| Customer Satisfaction Score | Predicts future bookings; identifies areas for service improvement; builds customer loyalty | Subjective; low survey response rates; may not always directly tie to profitability |
| Average Booking Value | Shows pricing effectiveness; reveals upselling opportunities; aids in forecasting revenue | Can be skewed by outliers; doesn't show booking frequency; impacted by discounts |
| Occupancy Rate | Tracks capacity utilization; helps with resource planning; uncovers demand trends | Doesn't consider per-seat profitability; over-reliance may lead to overbooking; seasonal variations complicate analysis |
| Customer Acquisition Cost | Measures marketing efficiency; informs budget allocation; identifies effective channels | Complex to calculate; may overlook long-term customer value; attribution issues can arise |
The most successful tour businesses rely on a mix of these KPIs rather than focusing on just one. While financial KPIs confirm if operational changes are boosting revenue, non-financial metrics often reveal the underlying causes of success - or challenges. Together, these metrics provide the insight needed to make strategic decisions and address potential problems before they grow.
How To Create a KPI Dashboard in 10 Minutes!
How to Set Up KPI Tracking Systems
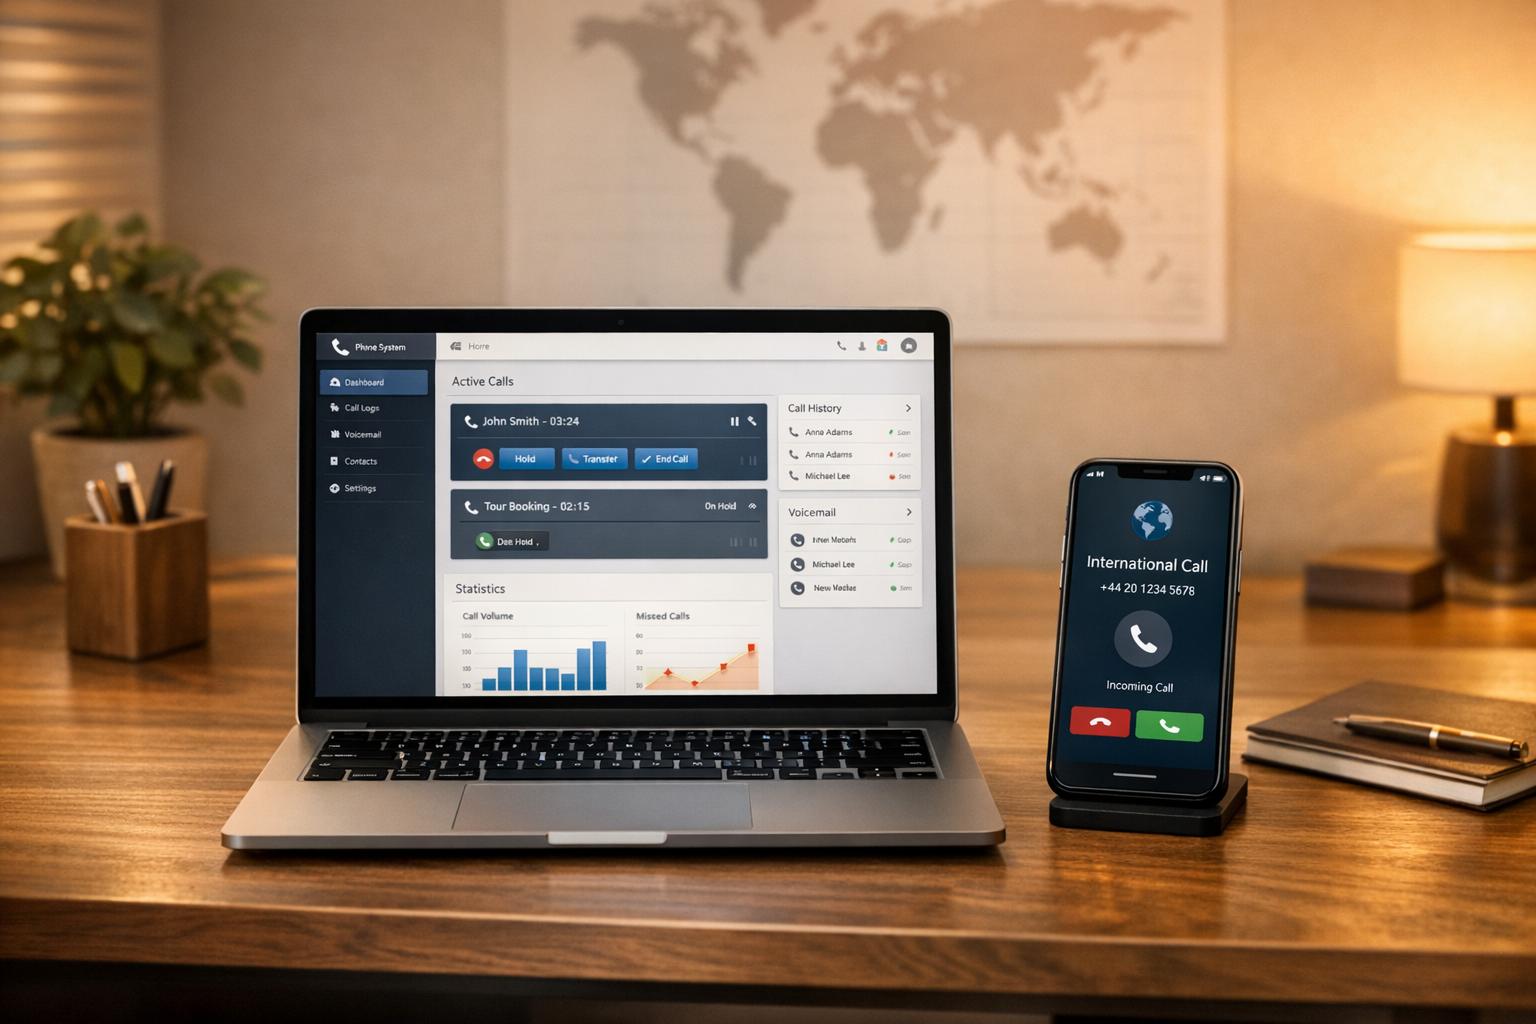
A well-designed KPI tracking system turns raw data into meaningful insights. The goal is to create a centralized setup that automatically collects data from your business tools and presents it in a way that simplifies decision-making.
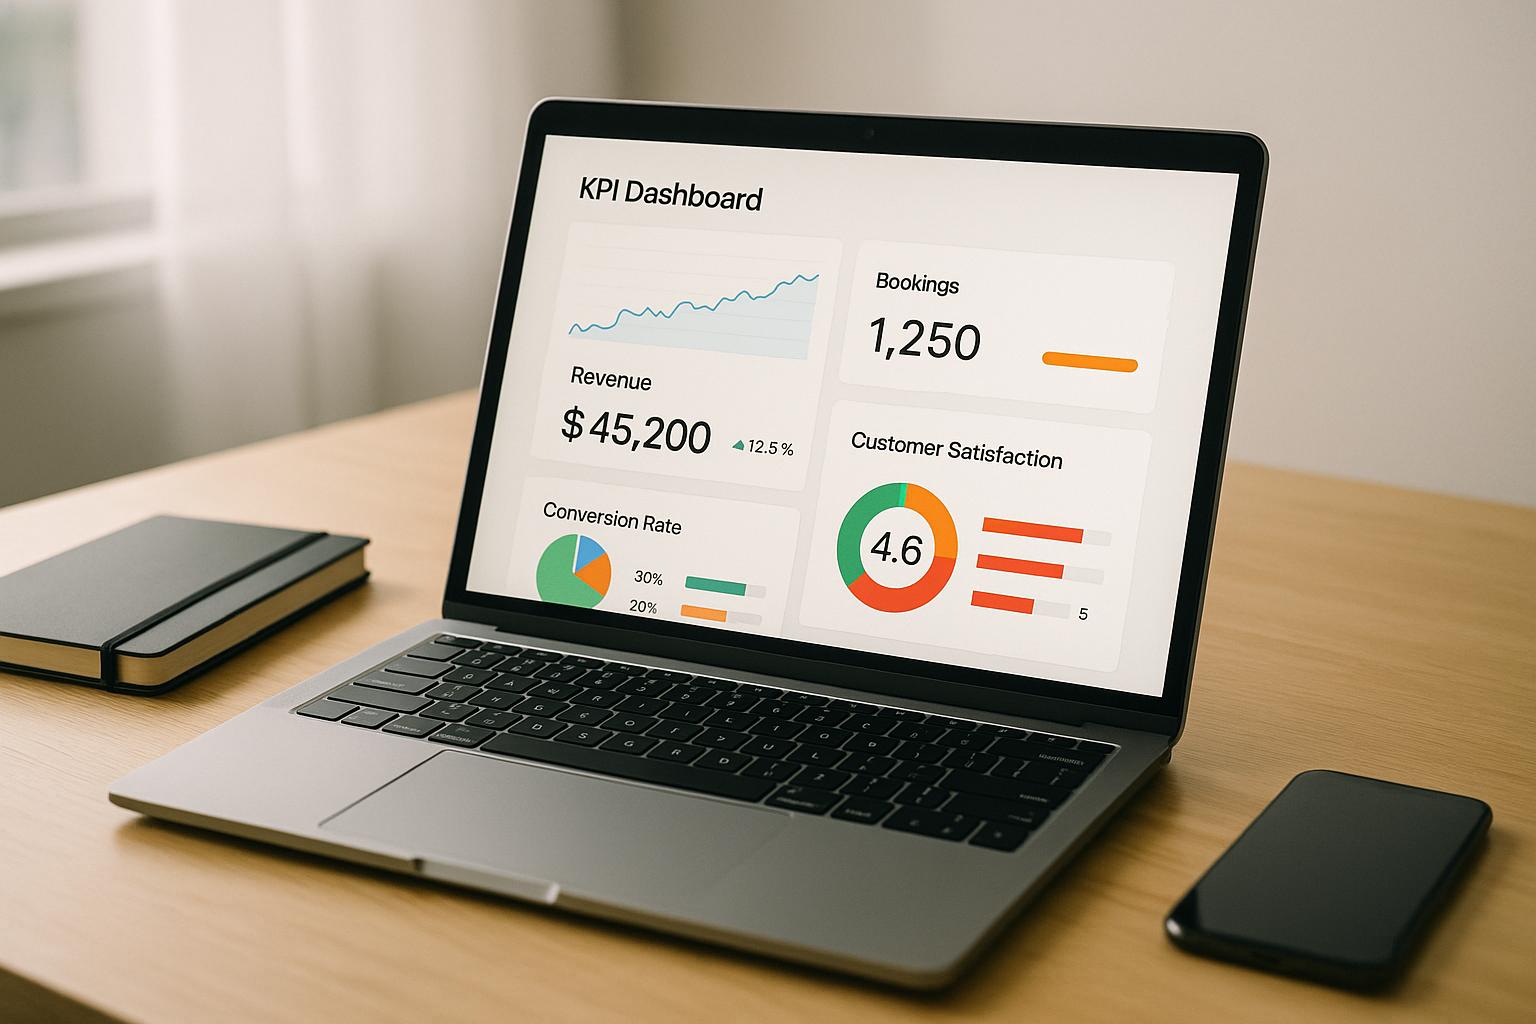
Build a Central Data Dashboard
Your booking system, payment processor, review platforms, and marketing tools all hold valuable KPI data. A centralized dashboard brings all this information together in one place.
Start by identifying all the sources of data your business relies on. For example, your booking platform can provide occupancy rates and conversion metrics, your payment processor tracks average booking values and revenue trends, and review platforms like TripAdvisor and Google offer insights into customer satisfaction. By integrating these sources, you can ensure a complete picture of your performance.
The best dashboards update automatically, eliminating the need for manual data entry. This requires connecting your systems through integrations or APIs that pull data directly into the dashboard. For instance, your booking system can automatically feed occupancy rates, while your payment processor supplies real-time revenue updates.
Design your dashboard with clarity in mind. Visuals like charts and graphs make trends easier to spot - a line graph showing booking conversions over six months is far more intuitive than a spreadsheet. Use color-coding to highlight performance: green for positive trends, red for areas needing attention, and yellow for metrics that require closer observation.
Once your dashboard is set up, the next step is finding tools that can seamlessly feed data into it.
Pick the Right Tracking Tools
Choosing the right tools is critical for capturing the metrics that matter and ensuring smooth integration.
Directoury is a helpful resource for tour operators, connecting them with technology providers who understand the needs of experience-based businesses. Their marketplace features over 200 verified vendors offering solutions for booking platforms, CRM systems, marketing automation, and analytics tools. Instead of spending weeks researching, operators can find personalized recommendations tailored to their business needs and budgets.
When selecting tracking tools, focus on solutions built specifically for the tour and activity industry. Generic business software often misses key features like weather-dependent bookings, group size management, or seasonal demand tracking. Industry-specific tools are designed with these details in mind, offering reports that reflect the unique challenges of experience businesses.
Integration is equally important. A booking platform that doesn’t sync with your CRM creates data silos, defeating the purpose of centralized tracking. Look for tools with strong API connections or built-in integrations to ensure your systems work together seamlessly.
Scalability is another factor to consider. A tool that handles 50 bookings a month might not perform well when your business grows to 500. Opt for platforms that can scale with your business without requiring a complete overhaul later.
Once you’ve chosen your tools, maintaining the accuracy of your data becomes the top priority.
Keep Your Data Accurate
Accurate data is the backbone of good decision-making. Even the most advanced dashboard is useless if the information feeding into it is unreliable.
Start by standardizing data entry processes. Create clear guidelines for entering key information, such as dates, customer names, and booking references. Regularly review data across systems to spot discrepancies - like mismatched revenue totals between your booking system and payment processor - and address issues immediately.
Set up your systems to flag unusual entries, such as bookings for zero people or tours priced at $0, which often indicate errors. These safeguards help catch mistakes before they distort your KPI calculations.
Training your team is essential. When employees understand how their data entry impacts decisions like pricing or marketing, they’re more likely to take care with their work. Share examples of how accurate data has led to positive business outcomes to reinforce the importance of their role.
Finally, implement automated backups and establish clear recovery protocols. This ensures that temporary glitches don’t result in permanent data loss, protecting the valuable insights your business relies on.
sbb-itb-3dd36ef
Turn KPI Data into Business Improvements
Using your centralized dashboard, transform KPI data into meaningful business changes. The top tour operators don’t just monitor metrics - they use them to make decisions that increase revenue, improve customer experiences, and optimize operations. By focusing on long-term trends, targeted actions, and industry benchmarks, you can uncover opportunities for strategic growth.
Track KPI Trends Over Time
Looking at KPI trends over an extended period can reveal patterns that short-term data might miss. For instance, a kayak tour operator could notice conversion rates dropping in early spring compared to summer. This isn’t necessarily a marketing failure - it could reflect customer concerns about unpredictable weather. In response, offering flexible cancellation policies or indoor alternatives might address these concerns.
Short-term trends can also highlight operational challenges. If customer satisfaction scores dip on specific days, it might point to issues like staff training gaps or scheduling inefficiencies. Similarly, a rise in booking values alongside a drop in conversion rates could suggest that customers are exploring premium options but abandoning the process at checkout, signaling the need for a simpler purchase flow.
Tracking marketing campaigns over time can reveal performance shifts. For example, a food tour operator monitoring social media ad spend might notice that cost per acquisition increases as campaigns age. This could indicate it’s time to refresh ad creatives to maintain effectiveness.
Establish baseline measurements during stable periods, then analyze how external factors - like weather, local events, or economic changes - impact your metrics. This historical perspective turns raw data into actionable insights.
Take Action Based on KPI Data
KPI data is only valuable if it leads to action. Use your insights to make targeted changes across key areas of your business:
- Pricing and marketing tweaks: High occupancy rates might justify raising prices, while low conversion rates could suggest the need to simplify your checkout process or update ad creatives. Compare conversion rates across marketing channels to allocate your budget more effectively, perhaps favoring email campaigns over social media ads.
- Operational adjustments: If satisfaction scores are lower on longer tours, consider adding more breaks, adjusting routes, or offering extra amenities. Inconsistent guide performance might require standardized training while allowing for personal flair.
- Enhancing customer experience: If customers are abandoning the payment stage, streamline the checkout process or offer more payment options. Repeated feedback about difficulty finding meeting points could mean it’s time to improve signage, provide clearer directions, or introduce digital check-in options.
Create a feedback loop to measure the impact of these changes. Don’t just implement solutions - track whether they deliver the desired improvements to your KPIs.
Compare Your Performance to Industry Standards
Benchmarking your KPIs against industry standards helps identify areas for improvement and determine whether challenges are specific to your business or part of broader market trends.
Conversion rates, for example, vary by experience type and price. Adventure tours often have lower conversion rates due to higher commitment levels, while food tours typically see stronger performance. If your conversion rates lag behind similar businesses, it might be time to evaluate your booking process, pricing, or marketing messaging.
Customer acquisition costs and average booking values also differ depending on the channel and tour format. Comparing your numbers to industry averages can highlight the most cost-effective channels, helping you refine your spending or adjust pricing strategies.
Customer satisfaction benchmarks, like Net Promoter Scores or online reviews, provide additional context. High scores suggest strong performance, while lower ones highlight areas needing immediate attention.
After implementing changes, benchmarking against industry standards can validate your progress. Platforms like Directoury connect tour operators with analytics tools that provide benchmarking data tailored to business size, location, or experience type. This integration allows for more precise insights.
If your metrics exceed industry averages, consider adjusting your pricing strategy or expanding capacity. On the other hand, lagging KPIs might call for operational improvements or a reworked market strategy. Use these benchmarks as a guide to refine your approach, build customer loyalty, and achieve standout performance.
Build a Data-Driven Tour Business
To run a successful tour business, you need more than just great destinations and engaging guides - you need to let data guide your decisions. The key is to consistently collect, analyze, and act on your key performance indicators (KPIs). Profitable tour operators understand that tracking KPIs isn’t a one-time task; it’s an ongoing process that ensures your strategies align with measurable insights.
Start by strengthening your centralized dashboard. This tool should integrate all your critical metrics - conversion rates, customer acquisition costs, and satisfaction scores - into one place for real-time monitoring. Without this central hub, spotting trends and making timely decisions becomes nearly impossible. A well-structured dashboard is your command center, helping you respond quickly to opportunities or challenges.
Don’t let disconnected tools slow you down. Instead, opt for integrated technology platforms that streamline your operations. Platforms like Directoury offer specialized solutions for businesses like yours, bringing everything under one roof to simplify management and improve efficiency.
Once your dashboard is in place, focus on creating actionable feedback loops. When you notice a dip in KPIs, act immediately - whether that’s simplifying the checkout process, tweaking your pricing, or addressing customer pain points. The faster you act on insights, the better your results.
It’s also important to compare your KPIs with industry benchmarks to gauge your progress. But don’t get bogged down in endless analysis. The most effective operators carve out time each week to review their data, prioritize the top three areas for improvement, and take concrete steps to address them.
Consistency is the secret weapon. Establish clear protocols for reviewing data - define who is responsible for monitoring specific metrics, how often reviews will happen, and what actions should follow when numbers fall below expectations. By treating your data as a roadmap, you’ll turn raw numbers into a competitive edge that fuels long-term growth.
Building a data-driven tour business doesn’t happen overnight. Begin with the KPIs that matter most for your business model, ensure your tracking systems are accurate, and expand your measurement capabilities as your operations grow. This iterative approach will help you stay agile and thrive in a competitive market.
FAQs
How can tour operators use KPI data to boost customer satisfaction and loyalty?
Tour operators can track key performance indicators (KPIs) like Customer Satisfaction Score (CSAT) and Net Promoter Score (NPS) to gain deeper insights into customer expectations. CSAT focuses on how happy customers are with specific parts of their experience, while NPS measures overall loyalty by asking how likely customers are to recommend your business.
Consistently reviewing these metrics allows operators to spot patterns, tackle problem areas, and make meaningful changes that improve the overall customer experience. This data-driven strategy not only boosts satisfaction but also builds lasting loyalty, paving the way for steady business growth.
What’s the best way to integrate multiple data sources into a single KPI dashboard?
To bring together multiple data sources into a single, centralized KPI dashboard, start by pinpointing the main systems where your data resides. This could include CRM platforms, booking tools, or even spreadsheets. It's crucial to ensure these data sources are both accurate and regularly updated to maintain reliability.
The next step is to leverage integration tools or software that can pull data from these various platforms into one unified dashboard. Automating this process can save time and help minimize manual errors. When designing the dashboard, keep it straightforward and user-friendly. Place the most important KPIs at the top, and use visuals like charts or graphs to make trends and patterns easy to spot at a glance.
Centralizing your data not only provides a clear overview of your performance but also enables you to make quicker, data-informed decisions that can improve your business operations.
What are the best KPIs for small tour businesses to focus on with limited resources?
Small tour businesses can maximize their potential by honing in on a few key performance indicators (KPIs) that directly support their goals. A good starting point is tracking booking volume, which reveals patterns in demand and revenue, and average booking value, a metric that evaluates how well pricing strategies are working.
Other important KPIs to monitor include customer acquisition cost (CAC), which provides insight into the efficiency of marketing efforts, and online reviews and ratings, a critical measure of customer satisfaction and digital reputation. By focusing on these core metrics, small businesses can make smarter, data-driven decisions without stretching their resources too thin.